Effortless Insights: Key Features of HubSpot’s Free Analytics Tools
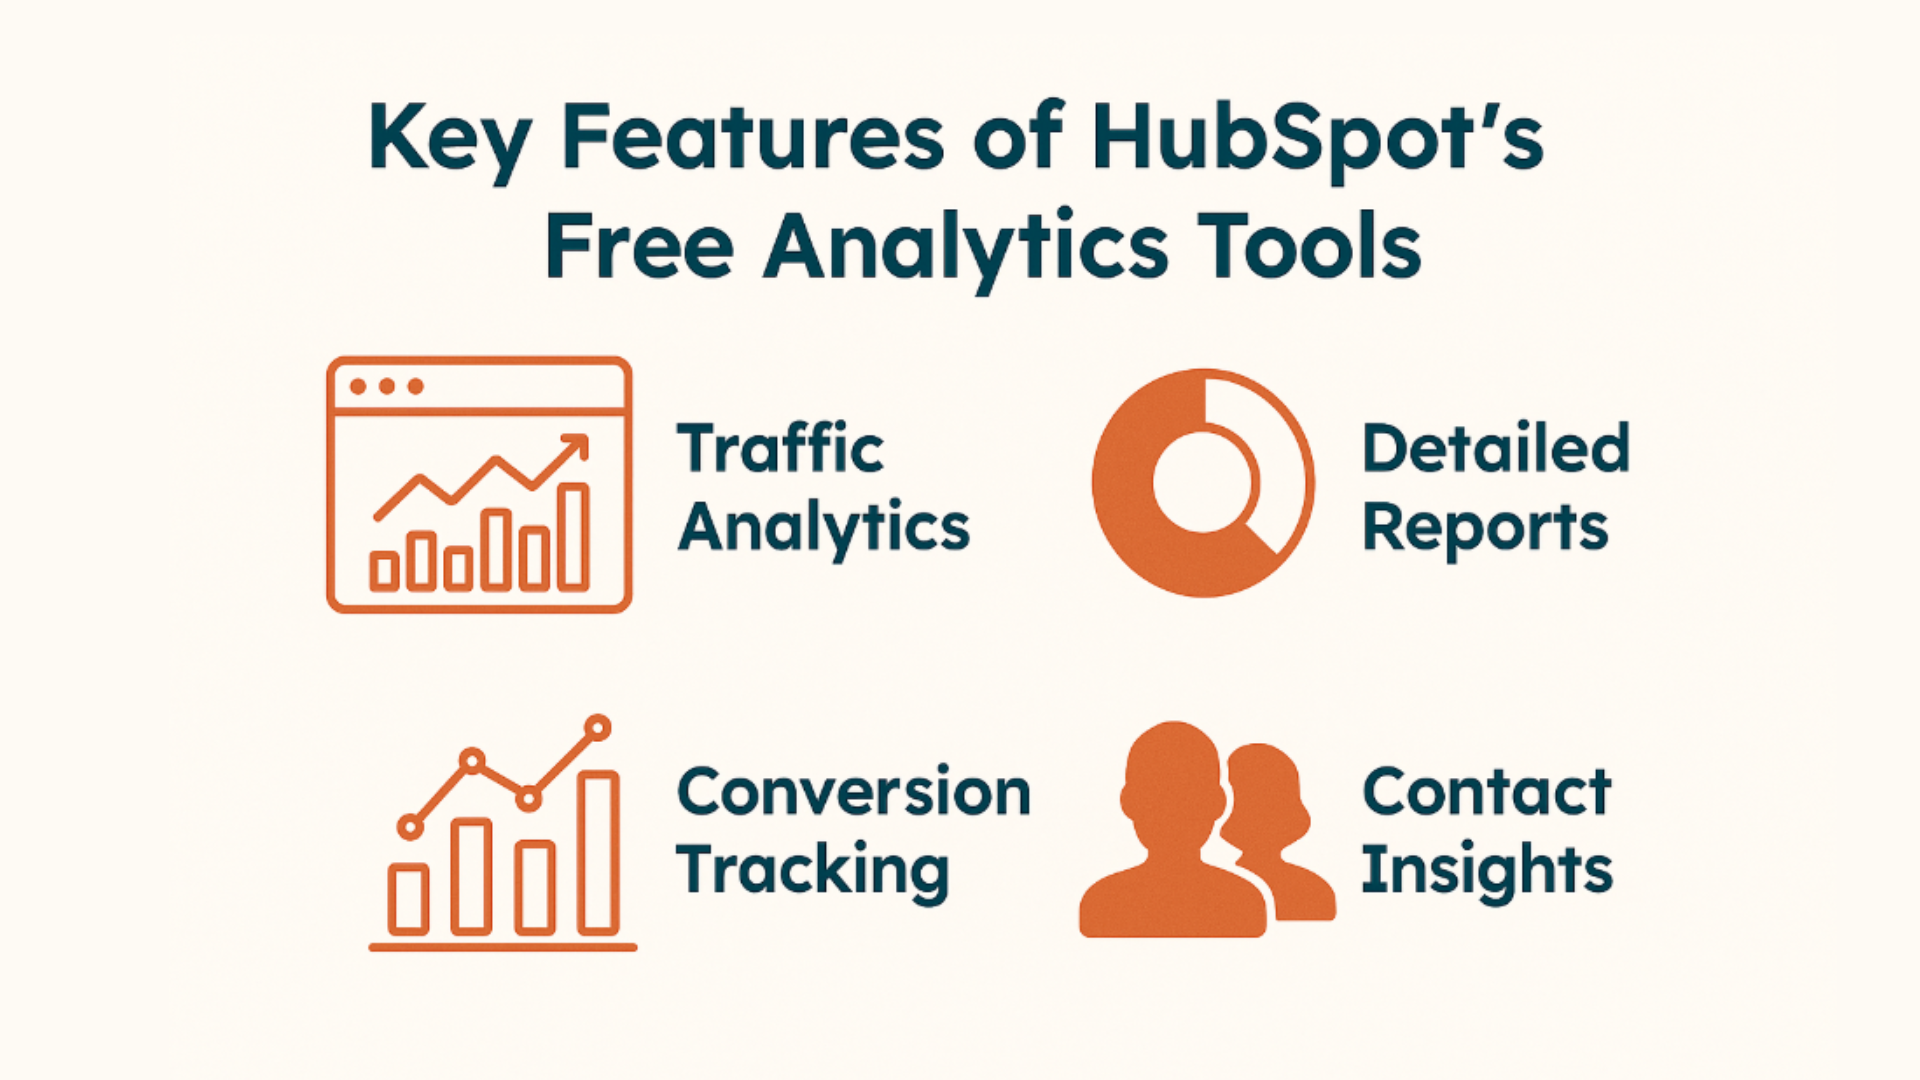
For small businesses and non-technical teams, understanding marketing performance shouldn’t require a data scientist.HubSpot removes the barriers that keep non-technical users from getting real marketing insights. With simple dashboards, effortless setup, and intuitive reporting, you’ll transform raw numbers into smart strategies—fueling growth, improving ROI, and making every decision data-driven. In this post, let’s dive into the most powerful features you can use today—no analyst required.
1. Ready-to-Use Dashboards
HubSpot provides instant access to dashboards that are pre-populated with essential marketing and sales metrics. These dashboards present a clear snapshot of your business’s health, showing sources of traffic, leads, sales pipeline progress, and more—all in one place. Customization is easy: users can drag-and-drop modules to prioritize what matters, filter by date range, or adjust which metrics are visible. This empowers everyone in your team to stay up-to-date on performance without building complex reports or deciphering raw data.
2. Website Activity Tracking
With built-in tracking, HubSpot automatically logs visitor actions like page views, clicks, time on site, and navigation paths across your website. These insights reveal which pages attract the most attention, what visitors do before leaving, and which content keeps them engaged. This makes it possible for even non-technical users to optimize website structure, identify top-performing content, and spot areas for improvement based on actual user behavior—with no need to set up Google Analytics or deal with code snippets.
3. Email and Marketing Performance Analytics
Every email or campaign sent through HubSpot comes with automated reporting. The platform’s analytics display open rates, click rates, bounce and unsubscribe rates, and comparison graphs for different campaigns. Non-technical users can instantly evaluate what works—subject lines, send times, formats—and adjust future campaigns for maximal engagement. No manual data compilation, formula writing, or external tracking required; HubSpot visualizes the most important stats in seconds.
4. Contact and Lead Management Reporting
Through HubSpot’s free CRM, you can visualize and analyze your customer and lead data. See how contacts grow over time, filter by source, segment by lifecycle stage, and check conversion rates at each funnel step. Interactive charts and filters allow non-technical users to track where leads come from, how they interact with your brand, and what percentage convert—offering actionable insights to improve acquisition and nurture strategies.
5. Opportunity Pipeline Visualization
HubSpot’s pipeline tools display all open deals, won/lost status, deal values, and the stage each opportunity is in. Instead of relying on spreadsheets or complicated CRM platforms, small business users get a visual, drag-and-drop interface for updating deal progress and spotting bottlenecks. This enables the whole team to forecast revenue, allocate resources, and prioritize follow-ups—making sales management accessible to everyone.
6. Event Tracking
Events like form submissions, landing page views, content downloads, and CTA clicks are tracked automatically. You can monitor what prompts visitors to take action and which assets generate leads or sales. Results appear in clear, graphical reports, allowing teams to tweak CTAs or landing pages based on real performance—no need for specialized tracking code or outside analytics tools.
7. Customizable Reports
Users can create, modify, and share custom reports using a simple click-and-select builder. Choose metrics, add filters, select visualizations, and save frequently used reports for instant access. Dashboards can be exported as PDFs, CSVs, or emailed to the team in one step, making reporting faster and more transparent for business owners and marketers alike—no technical configuration required.
8. Integration with Third-Party Apps
HubSpot integrates with dozens of popular business apps (email, calendar, e-commerce, social, Google Analytics, and more). Data sync happens automatically, meaning your dashboards pull in all your business stats—from sales to marketing, outreach to pipeline—in one place. This eliminates the need for manual imports/exports and ensures a holistic view without any technical complexity.
9. Visual, User-Friendly Design
All data and reports in HubSpot are presented with clean layouts, color-coding, and intuitive charts. Tooltips appear throughout the platform to explain metrics or guide next steps, supporting users who are unfamiliar with analytics terminology. As a result, small teams can quickly interpret data, recognize trends, and make confident decisions, even if they’re new to marketing analytics.
10. Safe, Collaborative Access
Team members and stakeholders can be granted secure access to dashboards with tailored permissions. This supports both internal collaboration—where relevant contributors see what they need—and external sharing with partners or clients. Sensitive data remains protected, and multiple team members can view, comment on, or act upon analytics without risking privacy or data integrity.
Conclusion
HubSpot’s free analytics tools deliver powerful, accessible features to non-technical users—meaning small businesses and teams can track, analyze, and act on marketing and sales data confidently, all without needing a data specialist or external analytics support.
Related Topics
About Yaman Kaushik
Yaman Kaushik is a contributor at HubsPlanet, sharing insights on HubSpot best practices, CRM strategies, and marketing automation to help businesses grow smarter.
Table of Contents
Stay Updated
Get the latest HubSpot tips and strategies delivered to your inbox.
Need Expert Guidance?
Get personalized recommendations from our certified HubSpot consultants.
Reading Progress
Estimated 3 minutes remaining